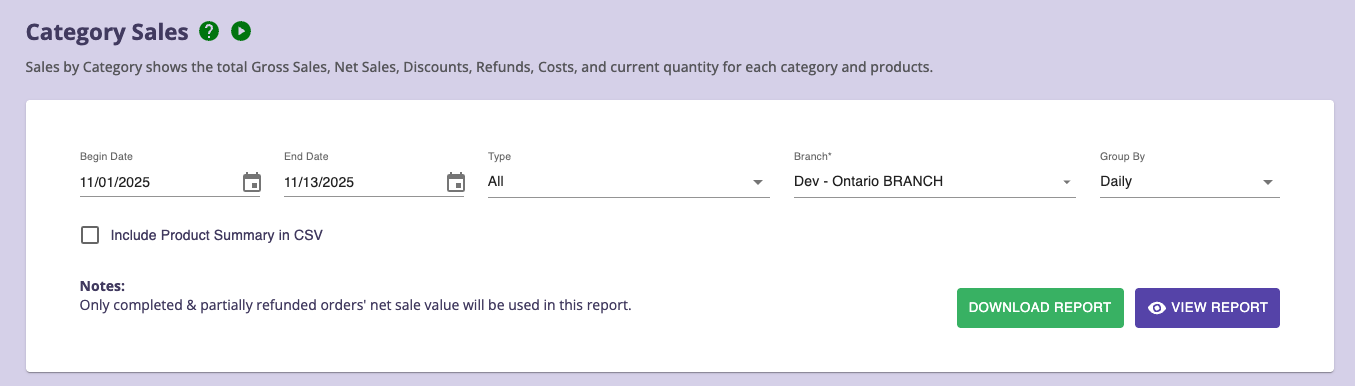
1. Report Filters
Use the filter panel at the top to define your reporting range:
Filters Available
-
Begin Date / End Date
Select a custom date range.
-
Branch (required)
Select the branch whose data you want to view, default is current Branch
-
Type
Choose All, Cannabis, Non-Cannabis.
-
Group By
Daily
Weekly
Monthly
Yearly
-
Include Product Summary in CSV
Check this option if you want the exported CSV to also include individual product-level details.
Actions
-
VIEW REPORT - Generates the on-screen chart and summary tables.
-
DOWNLOAD REPORT – Exports the results in CSV format, respecting your filters.
Note: Only completed and partially-refunded orders' net sales are included.
2. Net Sales Over Time (Chart)
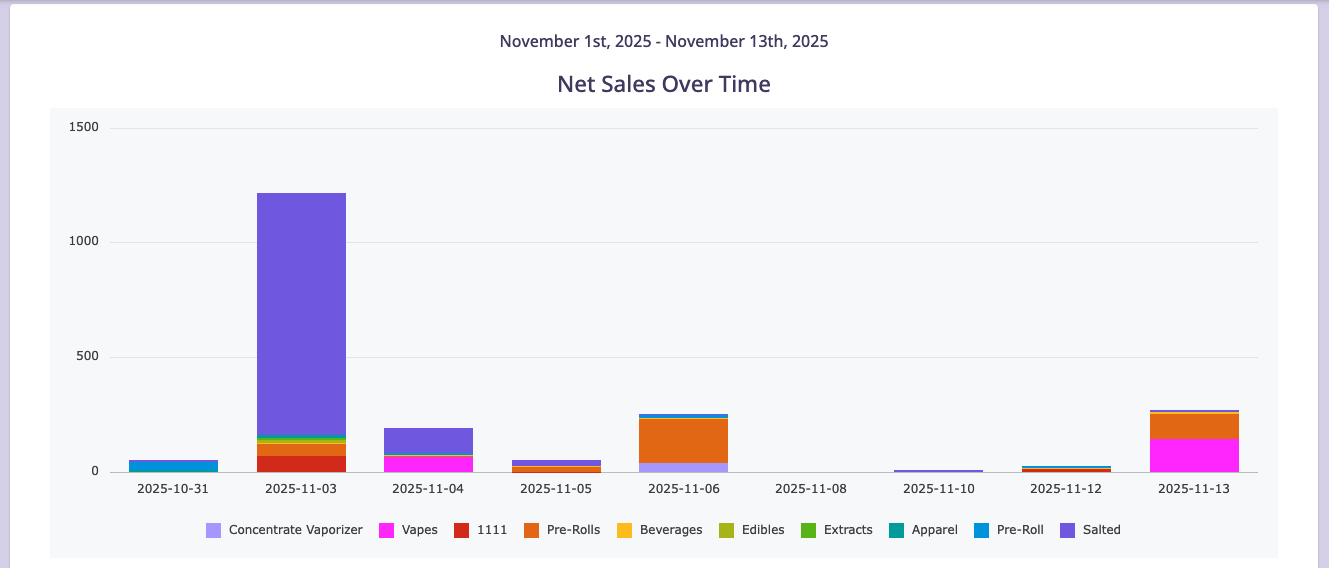
After clicking View Report, a stacked bar chart appears showing:
- Net sales per day (or per week/month depending on Group By)
- A breakdown of sales by category, color-coded
- Total net sales trend across the selected period
This helps you quickly identify peak sales dates and category contributions.
3. Parent Category Summary
This table summarizes sales by top-level categories (e.g., Cannabis vs. Non-Cannabis).
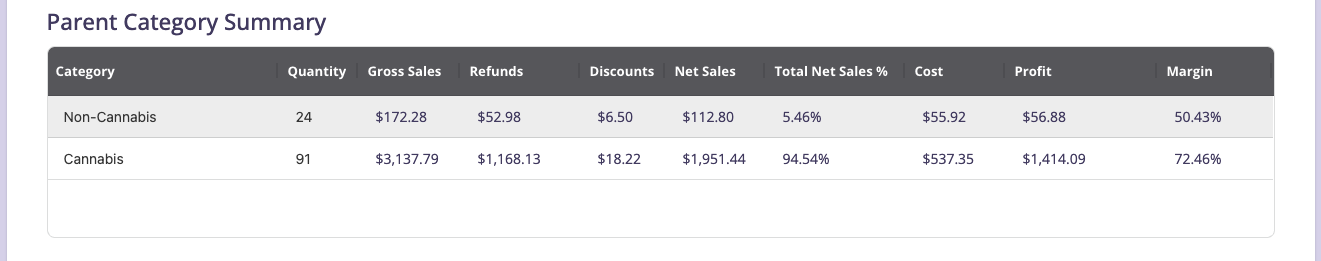
Columns
- Category
- Quantity
- Gross Sales
- Refunds
- Discounts
- Net Sales
- Total Net Sales %
- Cost
- Profit
- Margin
This summary gives a high-level breakdown of total performance before drilling deeper.
4. Sub-category Summary (AgGrid Table)
This interactive table provides detailed results for each sub-category.
You can sort, filter, and inspect performance directly within the grid.
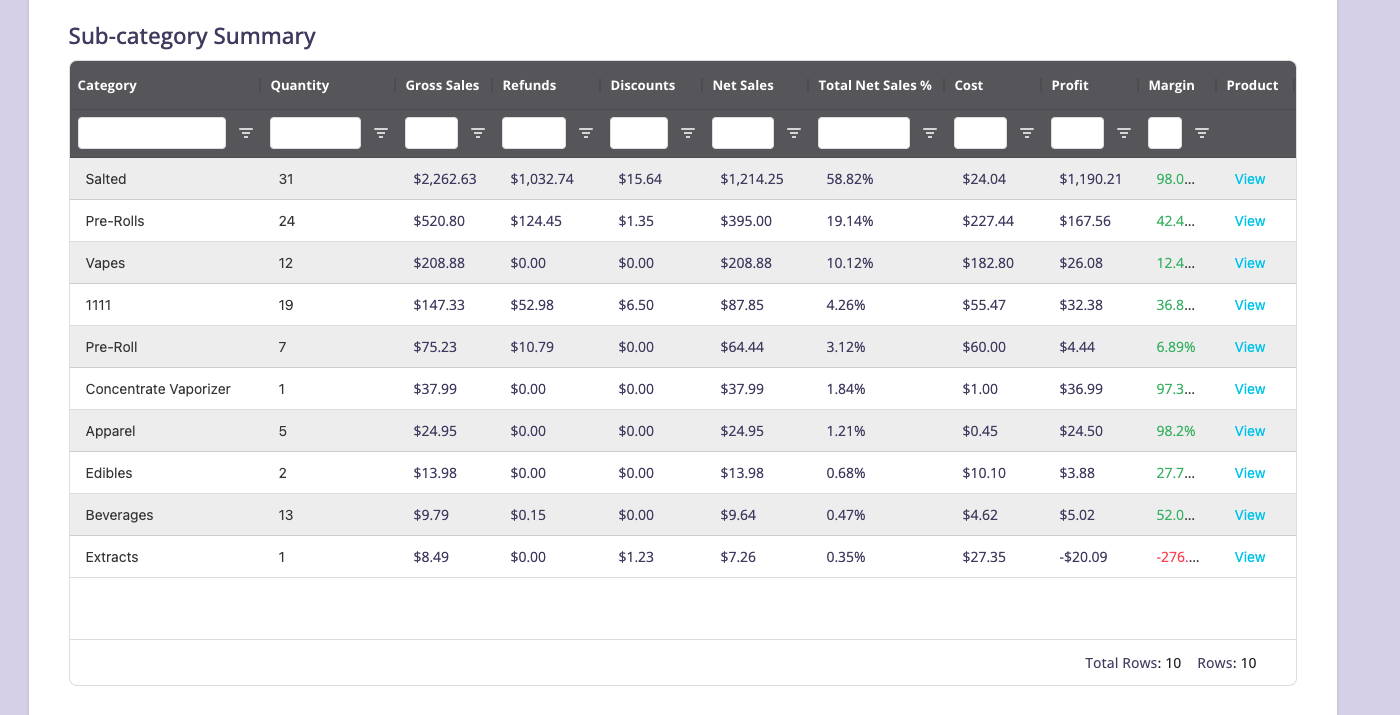
Columns Include
- Category
- Quantity
- Gross Sales
- Refunds
- Discounts
- Net Sales
- Total Net Sales %
- Cost
- Profit
- Margin
- Product (link to product list)
5. Data Grid (Sorting, Filtering, Search)
a. Sorting
Click any column header to:
- Sort ascending
- Sort descending
- Clear sorting (click a third time)
b. Column Filters
A filter row appears directly under each column header:
- Type keywords to filter text columns (e.g., typing “Vapes” shows only Vapes rows)
- Use the filter button to open advanced filters (e.g., “Net Sales > 100”, “Margin ≥ 20%”)
- Clear sorting (click a third time)
c. Search Example
-
In Category, type: pre
→ Filters results to Pre-Roll, Pre-Rolls, etc.
d. Resize or Reorder Columns
- Drag the edge of a column to resize.
- Drag the entire column header left/right to reorder.
6. Viewing Products Within a Sub-category
In the far-right column:
- Click View to open the product-level report for that specific sub-category.
This provides detailed SKU-level breakdowns for that category.
7. Exporting Data
Click Download Report to export a CSV file containing:
- Parent Category Summary
- Sub-category Summary
- (Optional) Product Summary if the checkbox is selected
Data in the file reflects your chosen:
- Date range
- Branch
- Group By
- Filters (only when applied before export)
9. Tips for Best Use
- Start with Group By: Daily to diagnose specific sales spikes.
- Use filters in the Sub-category grid to quickly isolate:
- High margin categories
- High refund categories
- Categories with unexpected profit dips
- If the report appears empty, confirm:
- Branch was selected
- Date range contains completed orders
- Filters in Data Grid are cleared