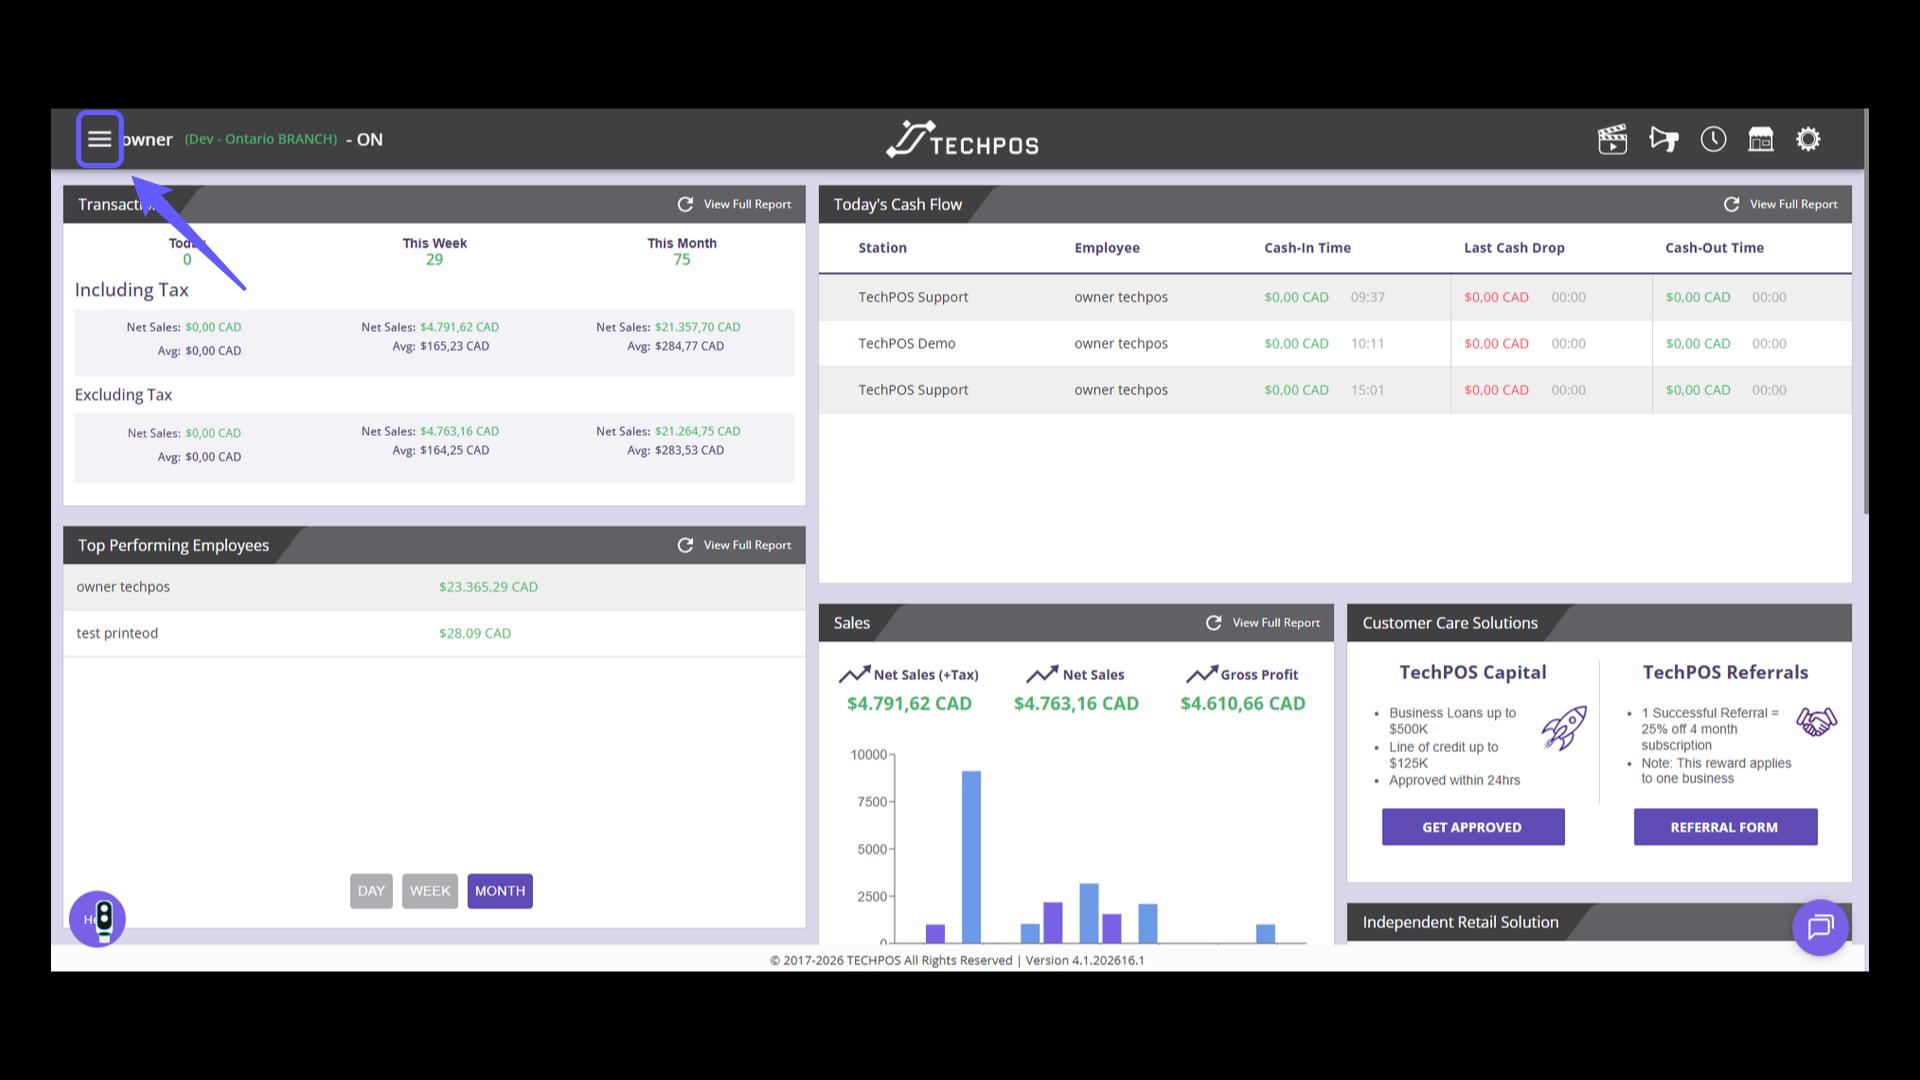
1. Access Main Menu
Tap the menu icon to open the main navigation options.
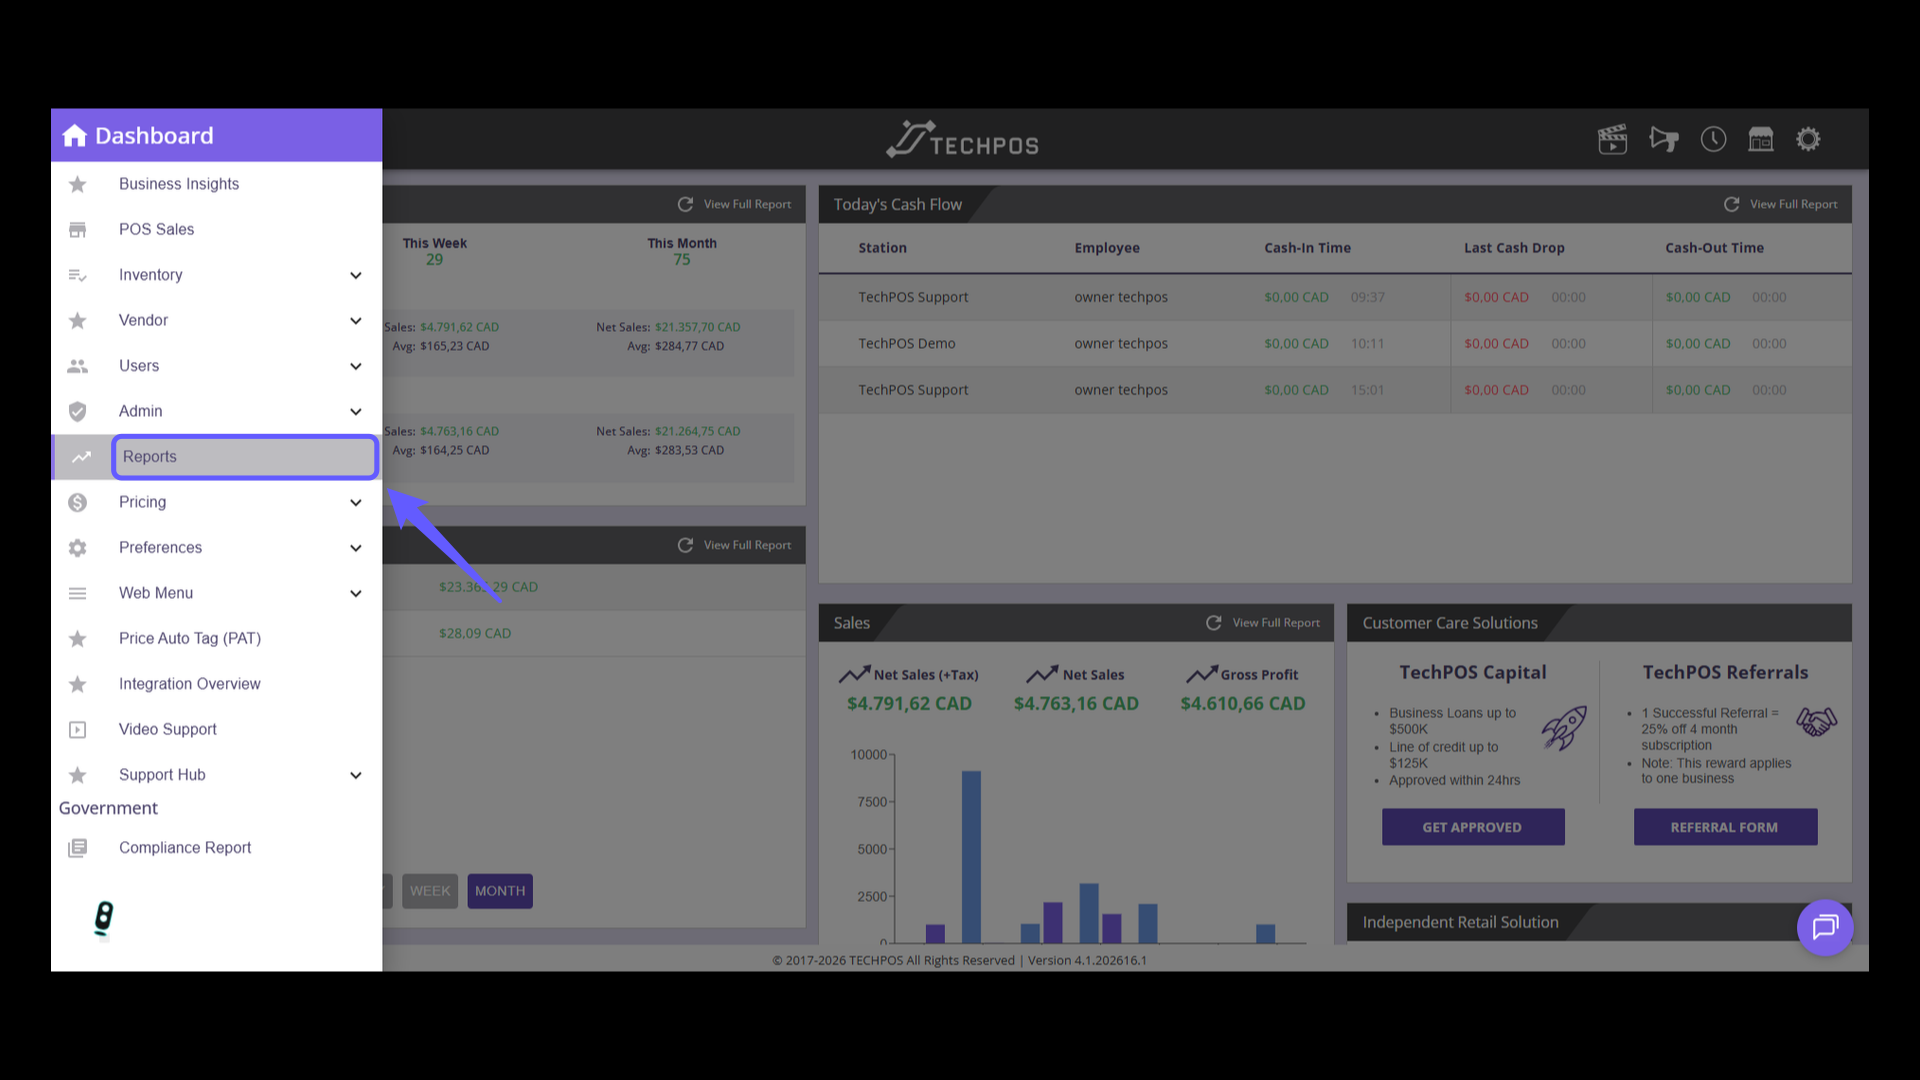
2. Access TechPOS Reports
Navigate to the dashboard menu and select 'Reports' to view TechPOS Reports.
3. Access Hourly Sales Reports
On Reports page, on Sales section, select 'Hourly Sales' to go into detailed sales data by the hour. This insight is invaluable for creating more efficient staffing schedules.

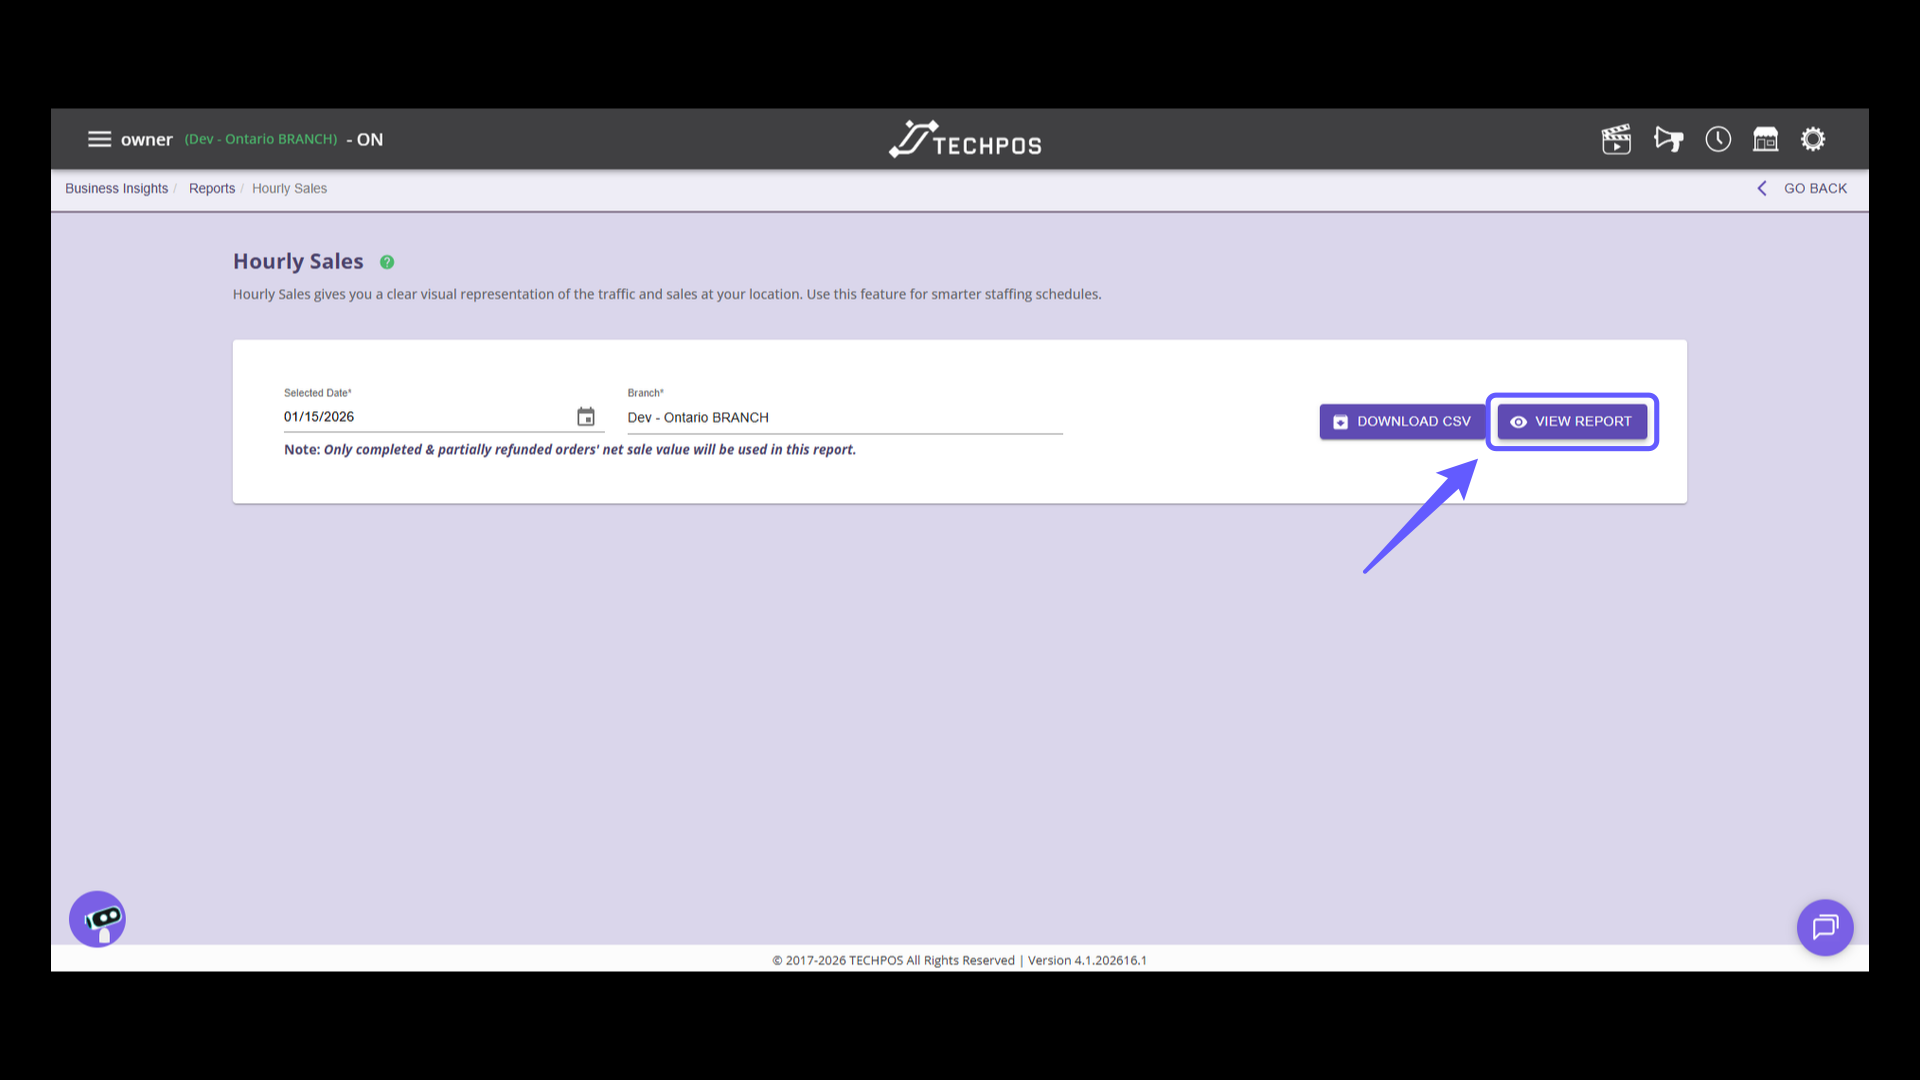
4. Access Hourly Sales Report
Choose your preferred data and branch to customize your report, then click 'VIEW REPORT' to explore the hourly sales data.
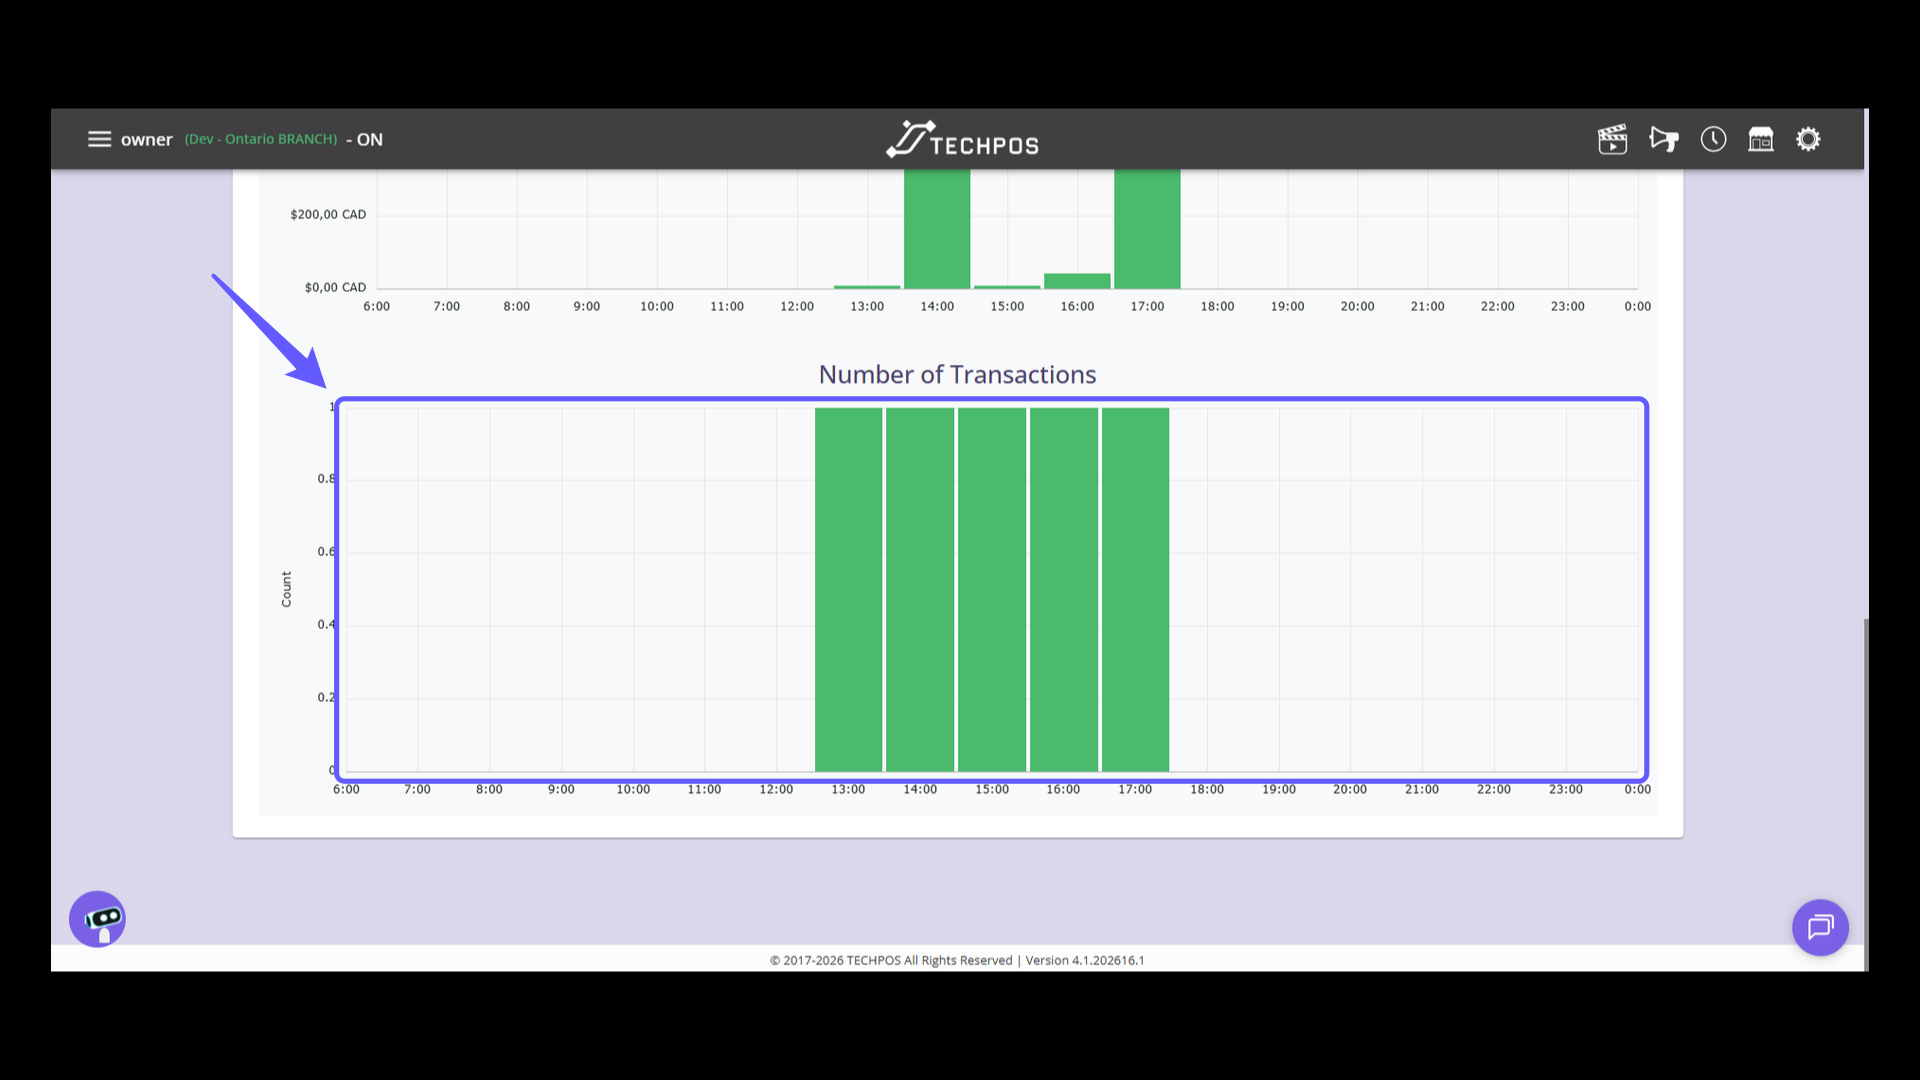
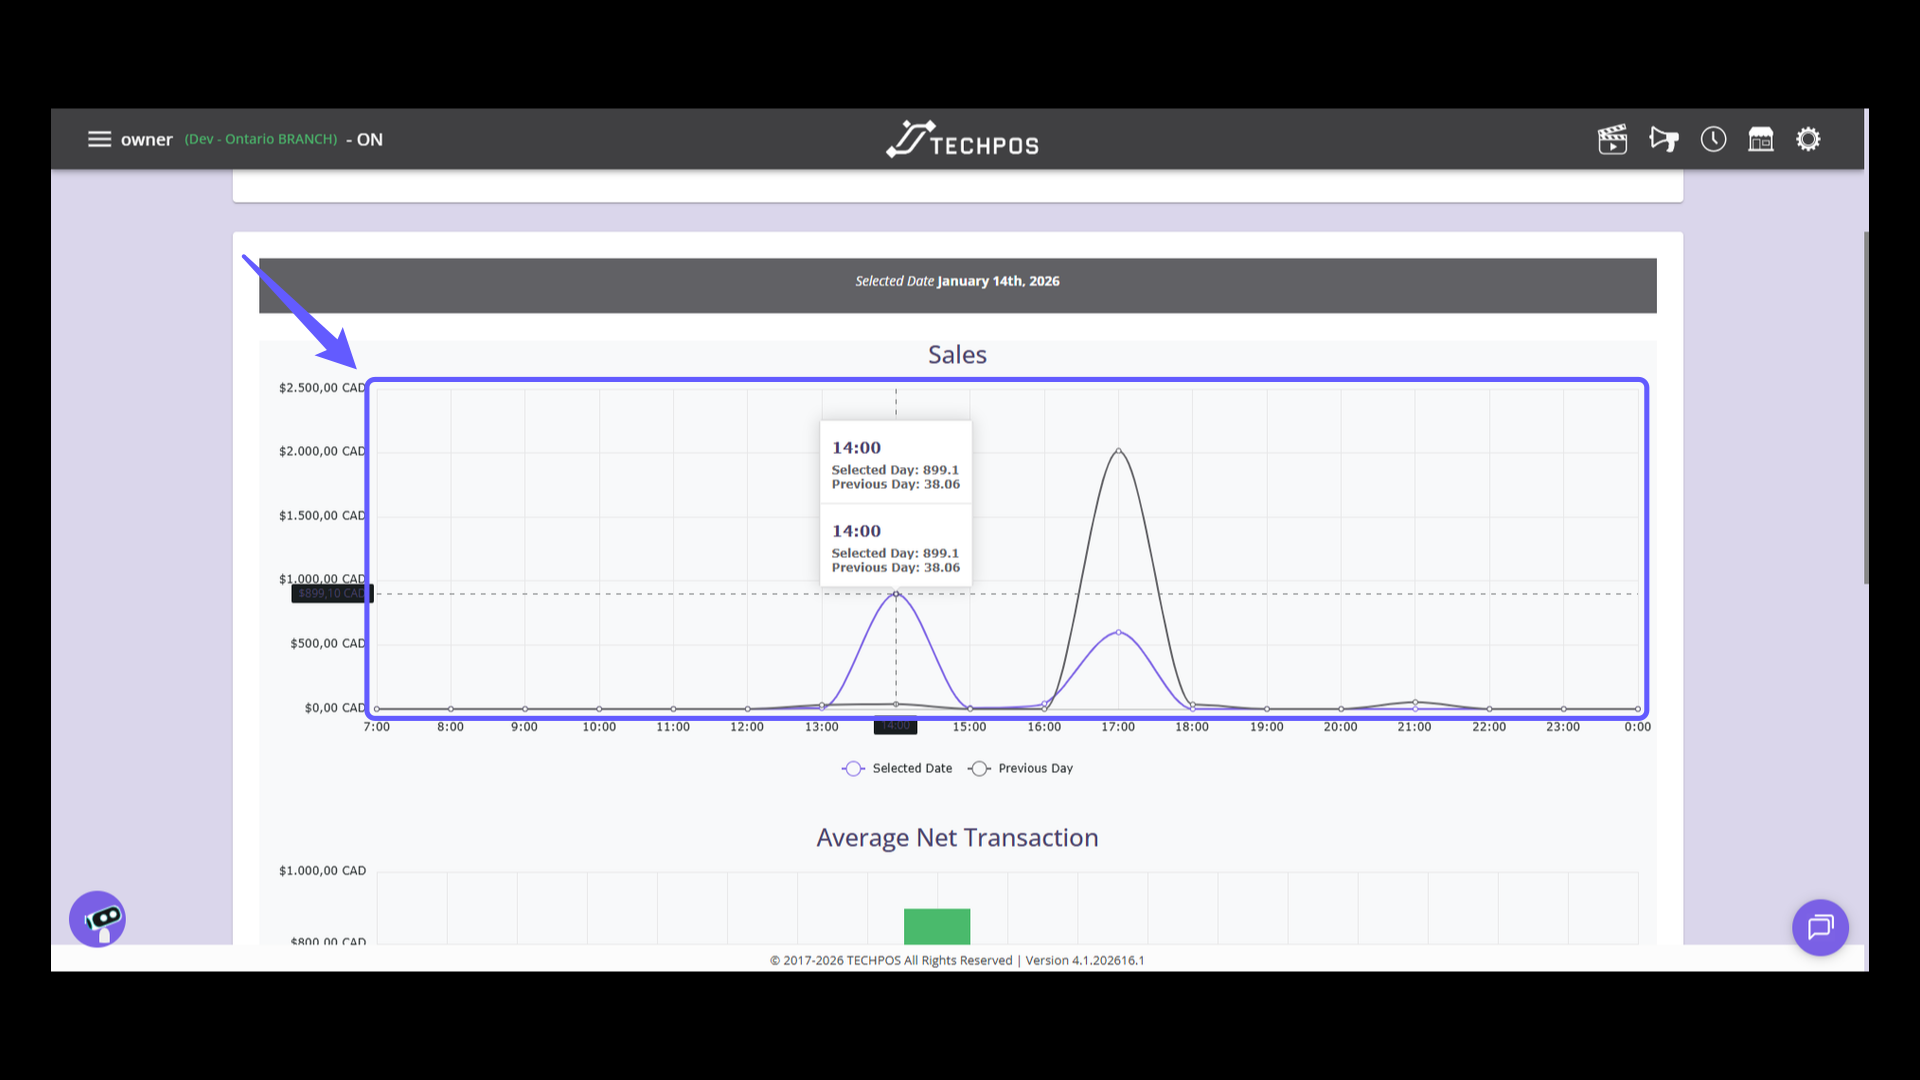
5. Analyze Sales Data by hour.
Explore Hourly Sales to visually capture your location's traffic and sales dynamics. Examine the graph, which outlines sales made on the chosen day, alongside a comparative line reflecting the previous day's performance.
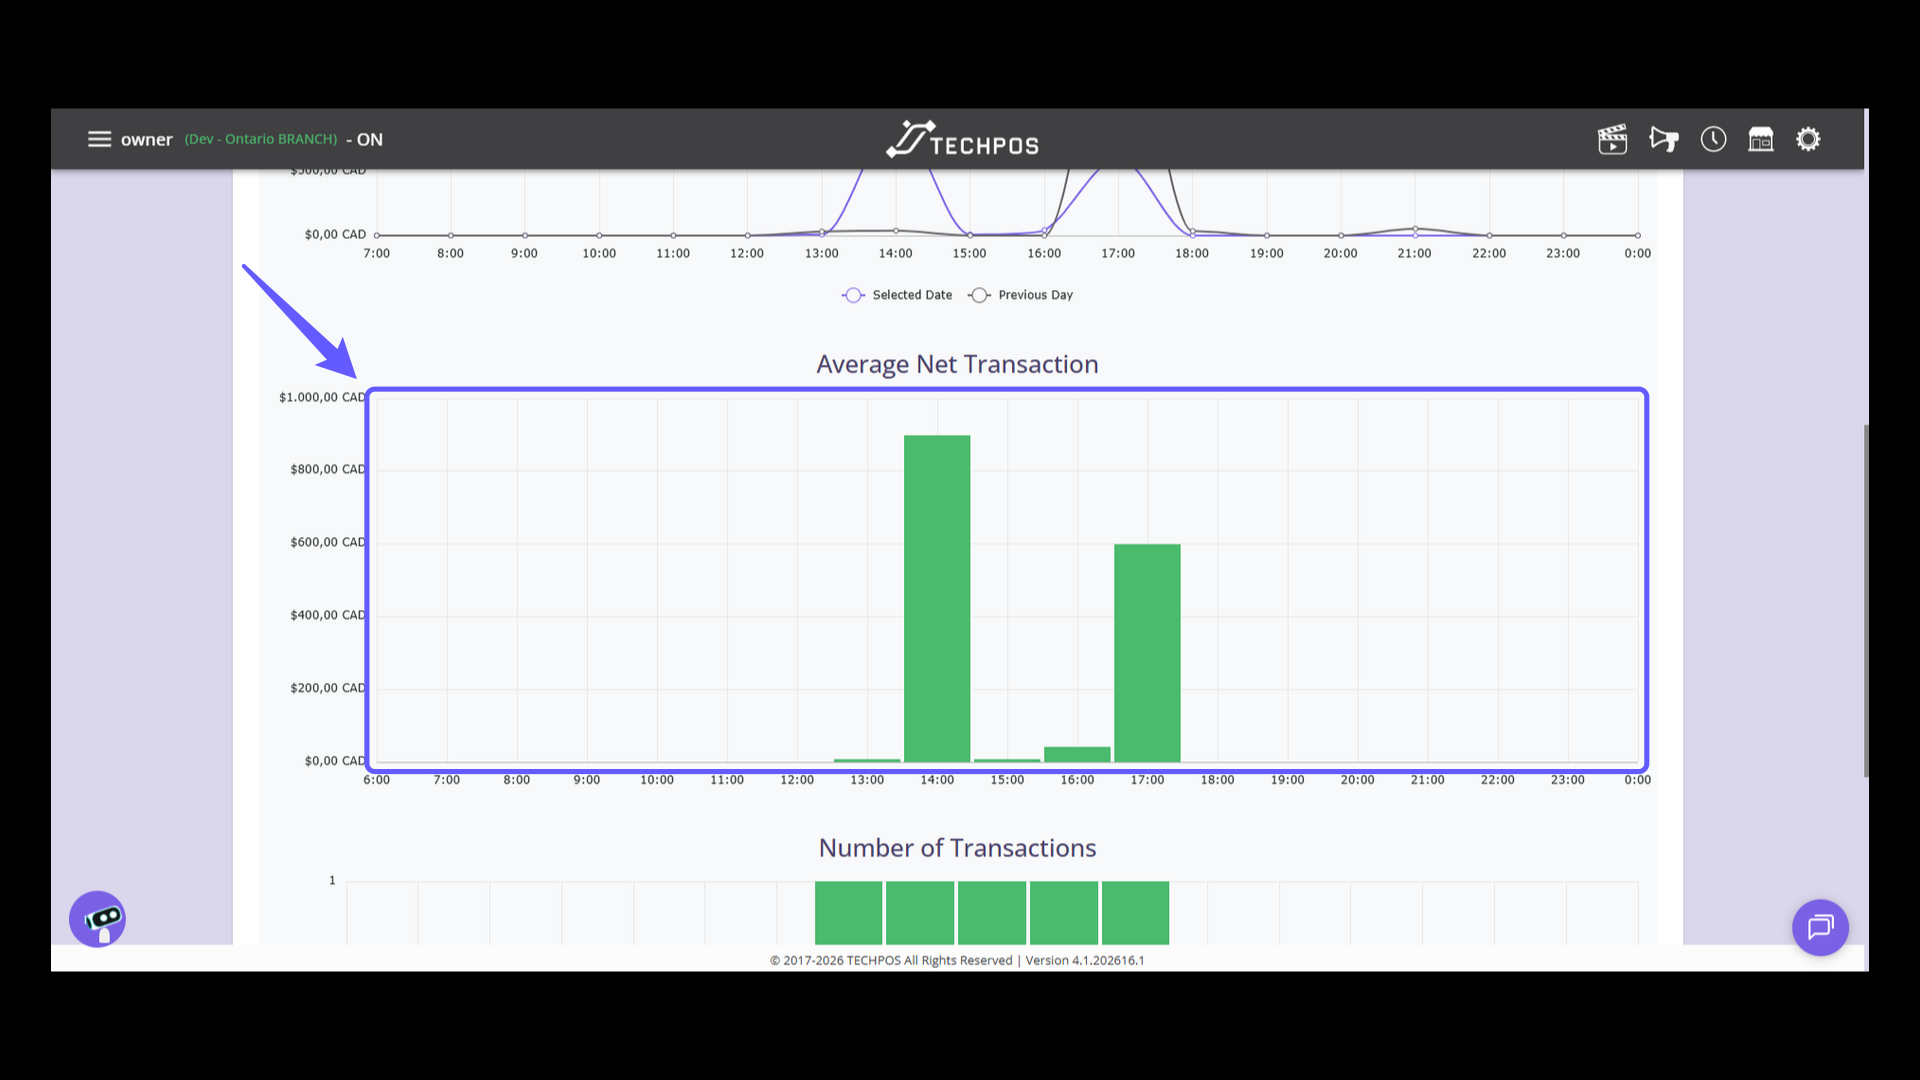
6. The Average Net Transactions
Examine the green bar graph to see the average net transactions over time. Pay attention to the axis labels to grasp the transaction values and identify the hours of peak activity.
7. Transaction Frequency
Utilize the report to view transaction counts in the bar chart. This data is invaluable for optimizing staffing levels and enhancing customer service during peak periods.