1. Report Filters
Use the filter panel to define which products you want to include in the report.
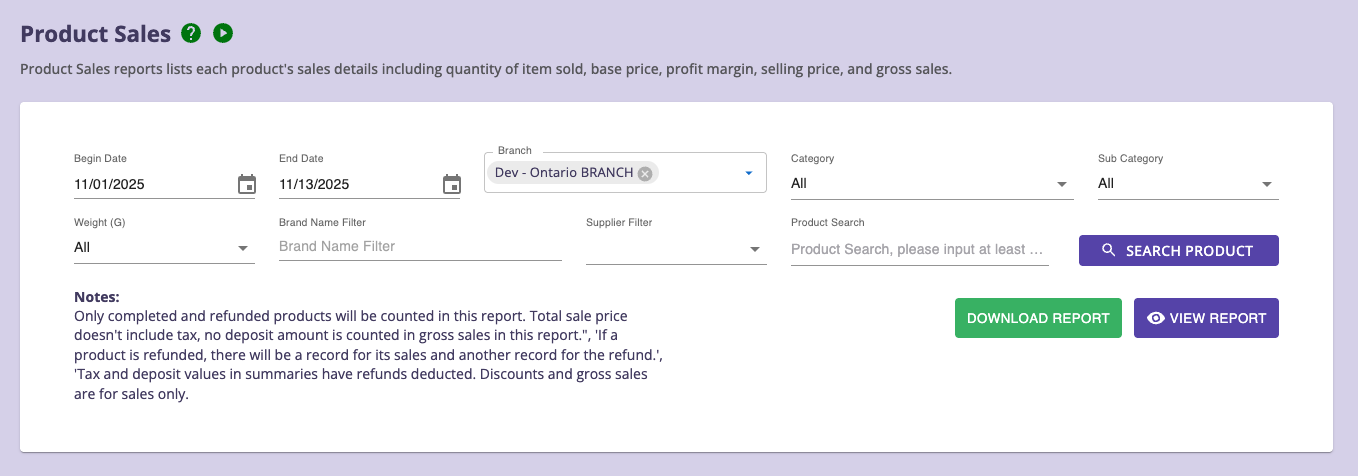
Filter Options
-
Begin Date / End Date
Choose a custom range for sales activity.
-
Branch
Choose the store branch, default is current branch, support multiple selection.
-
Category / Sub Category
Narrow results to a specific product group.
-
Weight (g)
Filter cannabis items by weight (e.g., 1g, 3.5g, 7g, 28g).
-
Brand Name Filter
Enter a brand name to limit results
-
Supplier Filter
Filter products by supplier.
-
Product Search
Search by product name, SKU, or UPC.
(Requires at least 3 characters to start searching.)
Actions
-
VIEW REPORT - Generates the full report with tables & charts.
-
DOWNLOAD REPORT – Exports results in CSV format.
Notes on Data
- Only completed and refunded products are included.
- Tax is excluded from product-level sales figures.
- Refunded products appear as:
- One row for the original sale
- One row for the refund (shown with negative values)
- Summary totals exclude:
- Refund tax
- Refund deposits
- Discounts and gross sales reflect sales only (not refunds).
2. Summary Section
Once the report loads, a summary bar shows totals for the selected time period
(Including Overall and the Summary by Category)
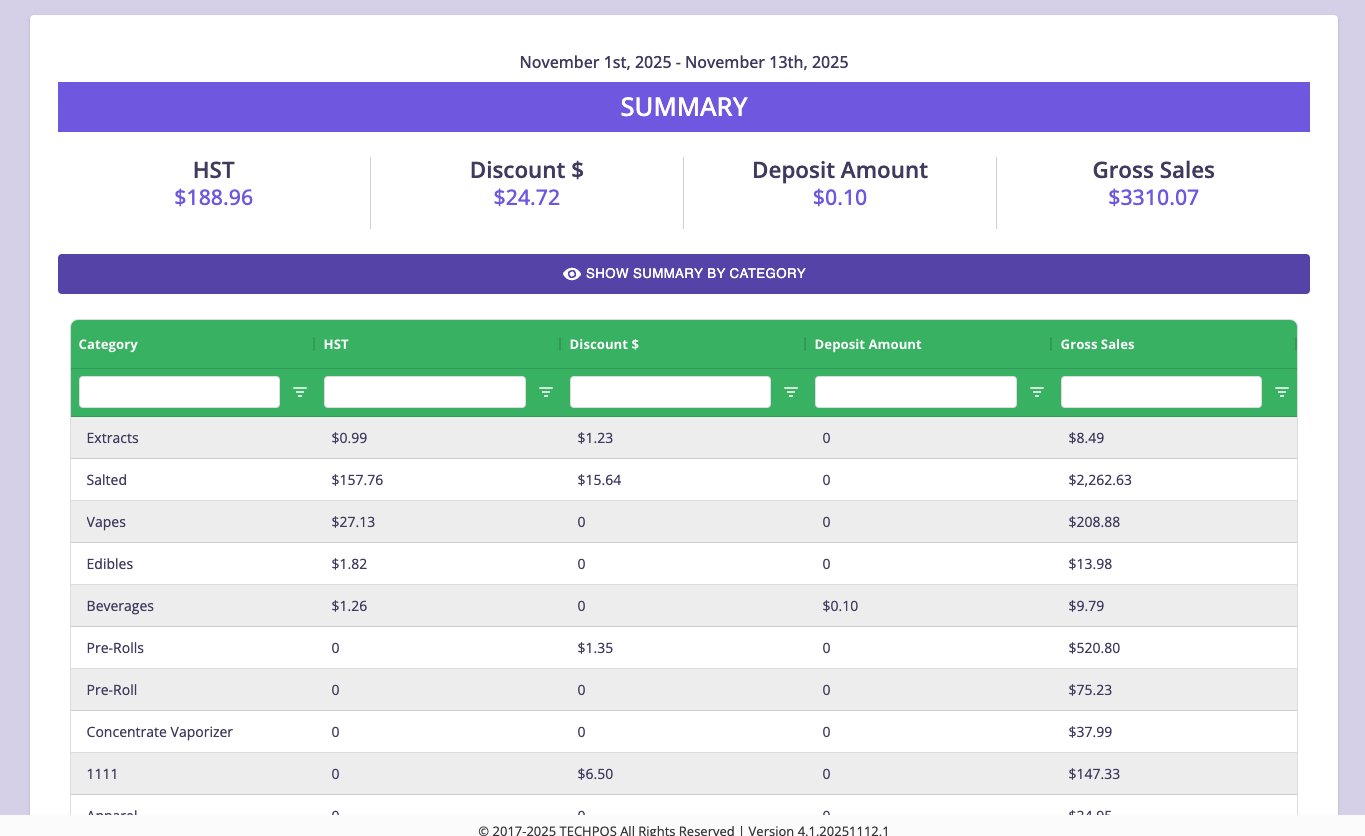
Summary by Category Data Grid
Columns include:
- Category
- HST
- Discount
- Deposit Amount
- Gross Sales
Filters and sorting are available for each column.
3. Sales Charts
Scroll down to view detailed time-based charts:
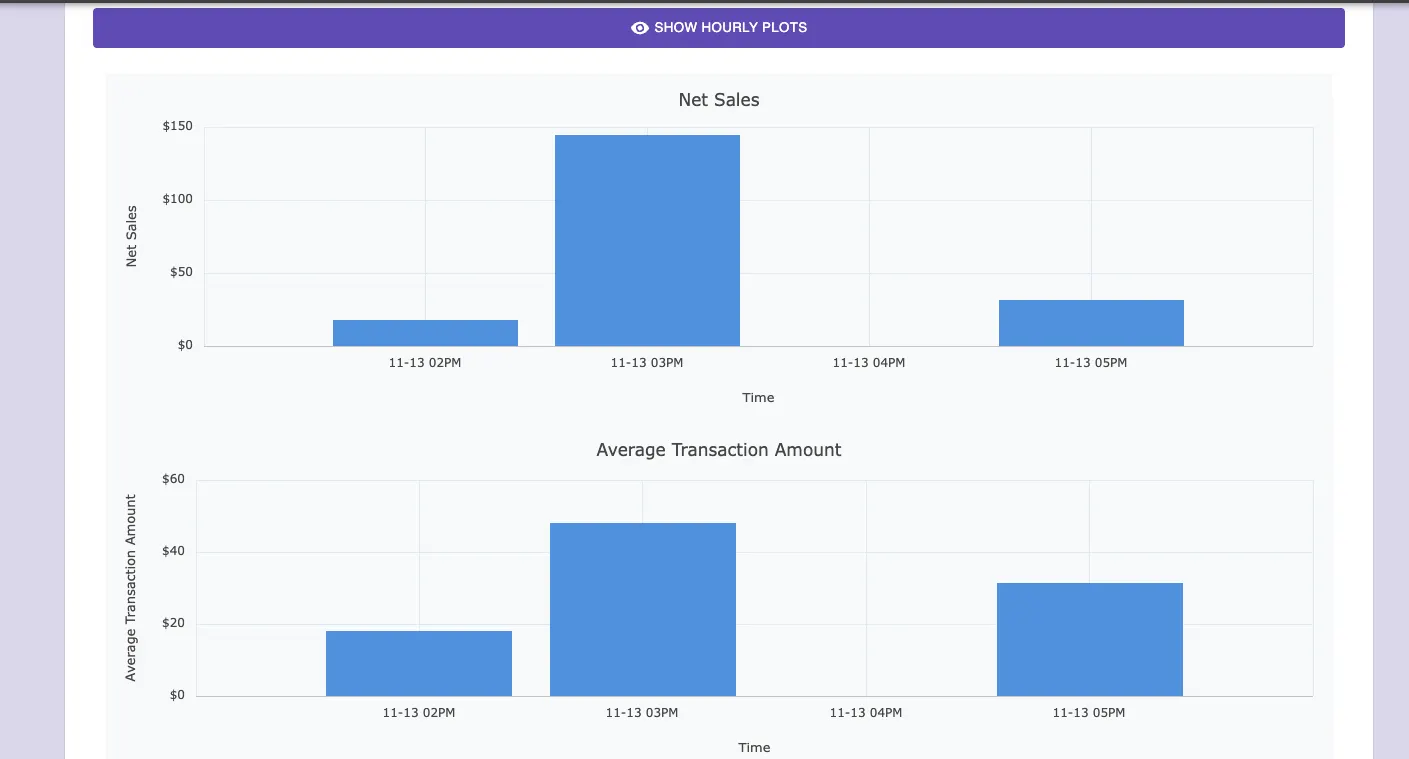
Hourly Plots
- Net Sales
- Average Transaction Amount
- Net Number of Transactions These charts help visualize peak sales hours and transaction trends.
4. Product Sales Detail Grid
This is the main section of the report, listing all product-level transactions.

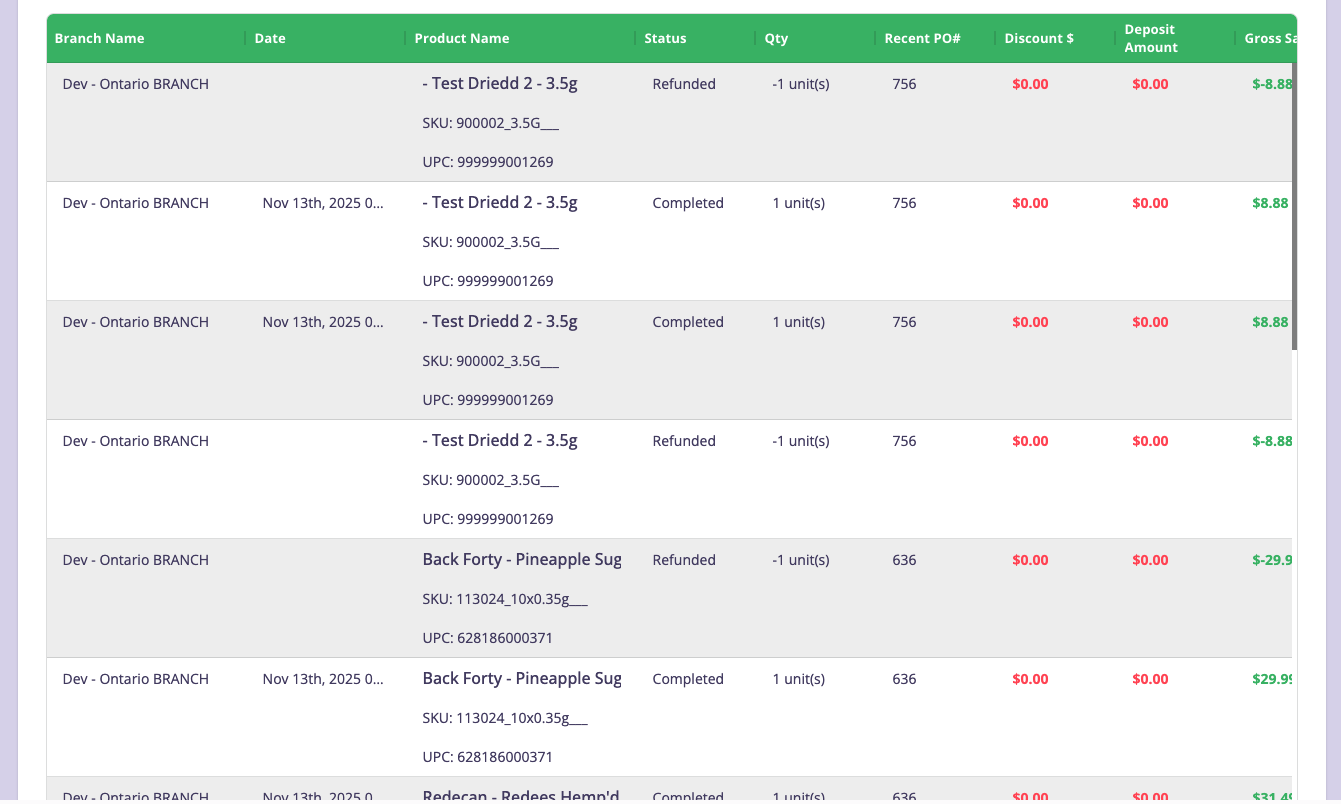
Columns
- Branch Name
- Date
- Product Name
- Status (Completed / Refunded)
- Quantity (negative qty for refunds)
- Recent PO#
- Discount $
- Deposit Amount
- Gross Sales (positive or negative)
- Weight
- Total Base Price
- Total Selling Price
- Profit Margin
- Cannabis Name
- Lot#
- Refund Reason
- Note
Refund rows always contain negative values for quantity and sales.
5. Data Grid (Sorting, Filtering, Search)
a. Sorting
Click column headers to sort ascending or descending.
b. Filtering
Each column has:
- A search box (text match)
- A filter button (conditions such as equals, contains, greater than)
Examples:
- Filter Status = Refunded
- Search “Pineapple” in Product Name
- Filter Gross Sales < 0 to see losses/refunds only
c. Resizing & Reordering
- Drag the right edge of the column to resize
- Drag headers left/right to reorder
6. Exporting Data
Click Download Report to export a CSV file containing:
- Product-level sales rows
- Refund rows
- Category summary (if applicable)
- All filtered results
Exports respect:
- Date range
- Branch
- Category
- Brand
- Search terms
- Weight / supplier filters
7. Tips for Effective Use
- Use Product Search or Brand Filter when you know the specific SKU you’re investigating.
- Use Status filter to isolate refunded items.
- Use Weight + Category filters for cannabis compliance reporting.
- Export the CSV for deeper analysis