1. Report Filters
Use the filters at the top to control what appears in the Summary, Charts, and Details sections.
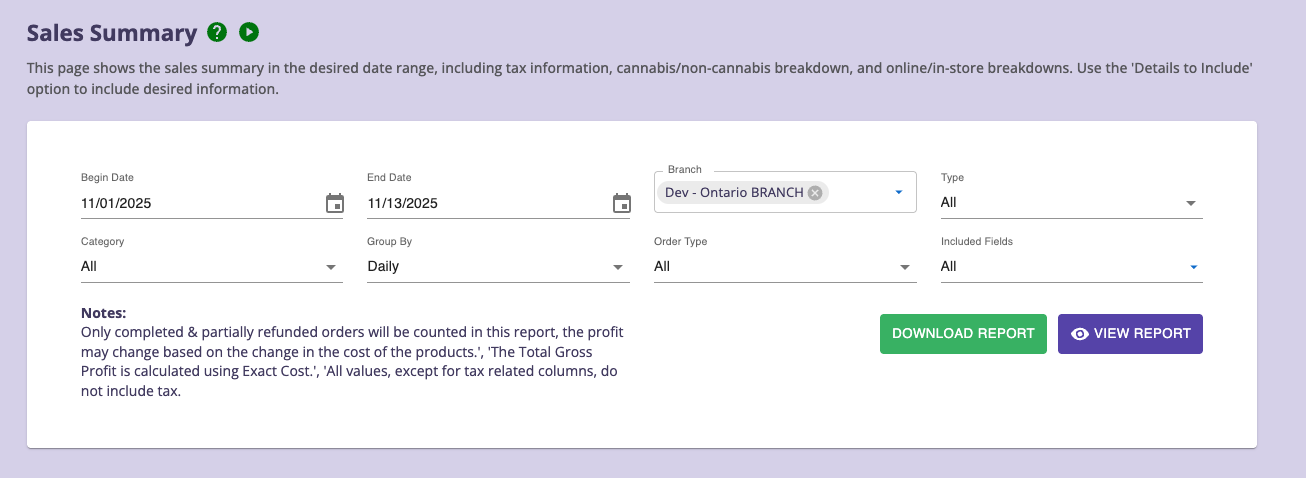
Filters Available
-
Begin Date / End Date
Select the reporting range.
-
Branch (required)
Choose the store branch, default is current branch, support multiple selection.
-
Type
Filter by Cannabis, Non-Cannabis, or All.
-
Category
Filter by Product Category.
-
Group By
Daily
Weekly
Monthly
Yearly
-
Order Type
All / InStore / Online.
-
Included Fields (Download Report Only)
Actions
-
VIEW REPORT - Displays summary, charts, and details.
-
DOWNLOAD REPORT – Exports results to CSV (including details grid).
2. Summary Section
The Summary tab shows four breakdowns:
- A. Overall Summary (Total)
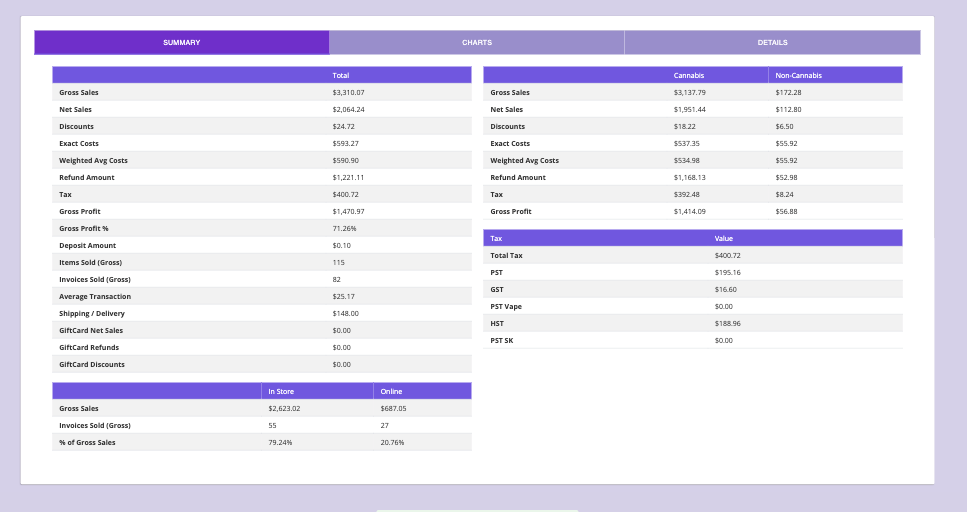 This includes key metrics:
- Gross Sales
- Net Sales
- Discounts
- Exact Costs
- Weighted Avg Costs
- Refund Amount
- Tax
- Gross Profit
- Gross Profit %
- Items Sold (Gross)
- Invoices Sold (Gross)
- Average Transaction
- Shipping / Delivery
- GiftCard Net Sales / Refunds / Discounts
- B. Cannabis vs. Non-Cannabis
Breaks down:- Gross Sales
- Net Sales
- Discounts
- Exact Costs
- Weighted Avg Costs
- Refund Amount
- Tax
- Gross
- Gross Profit
- C. In-Store vs Online
Shows for both sales channels:- Gross Sales
- Invoices Sold
- % of Gross Sales
- D. Tax Breakdown Table
Shows:- Total Tax
- PST
- GST
- PST Vape
- HST
- PST SK
3. Charts Section
Click the CHARTS tab to view visual breakdowns.
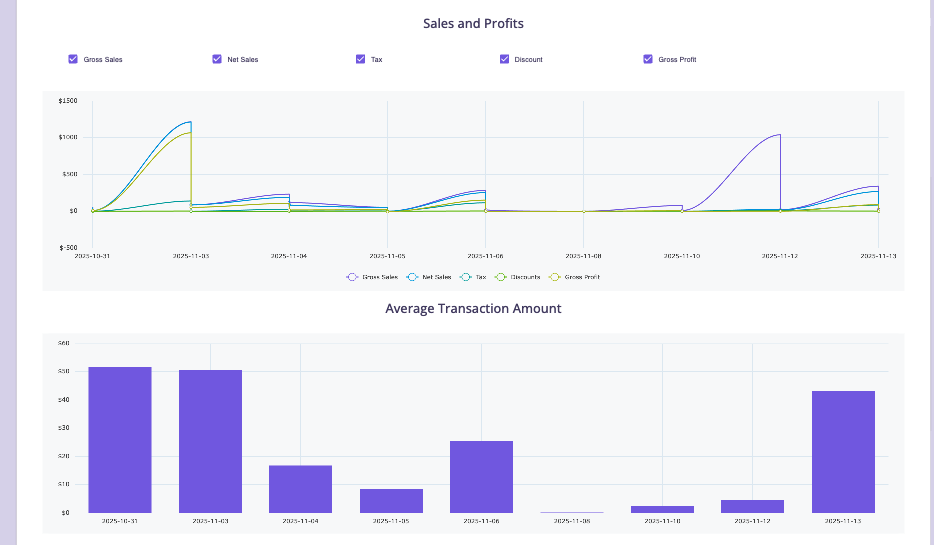
- Sales & Profits Chart
Includes:- Gross Sales
- Net Sales
- Discounts
- Tax
- Gross Profit
- Average Transaction Amount
Bar chart showing average spend per invoice over time.
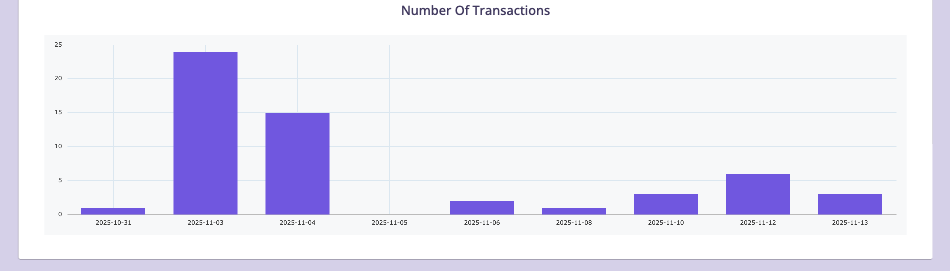
- Number of Transactions
- Daily/weekly/monthly transaction count depending on your Group By setting.
- These charts give quick insight into trends, peaks, and daily performance.
4. Details Section
This is the transaction-level view and the most detailed part of the report.
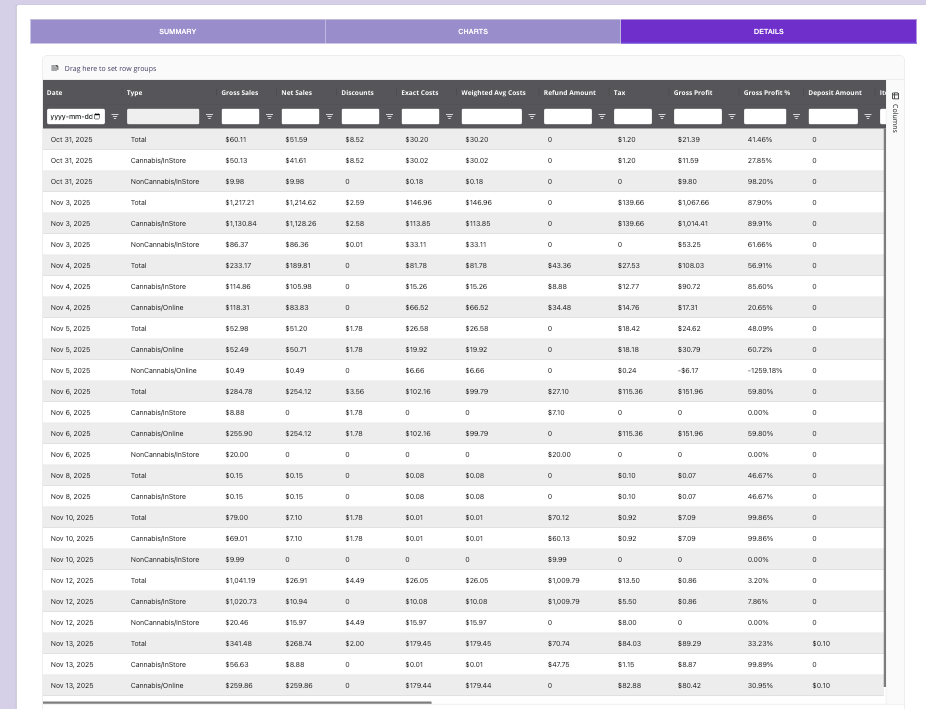
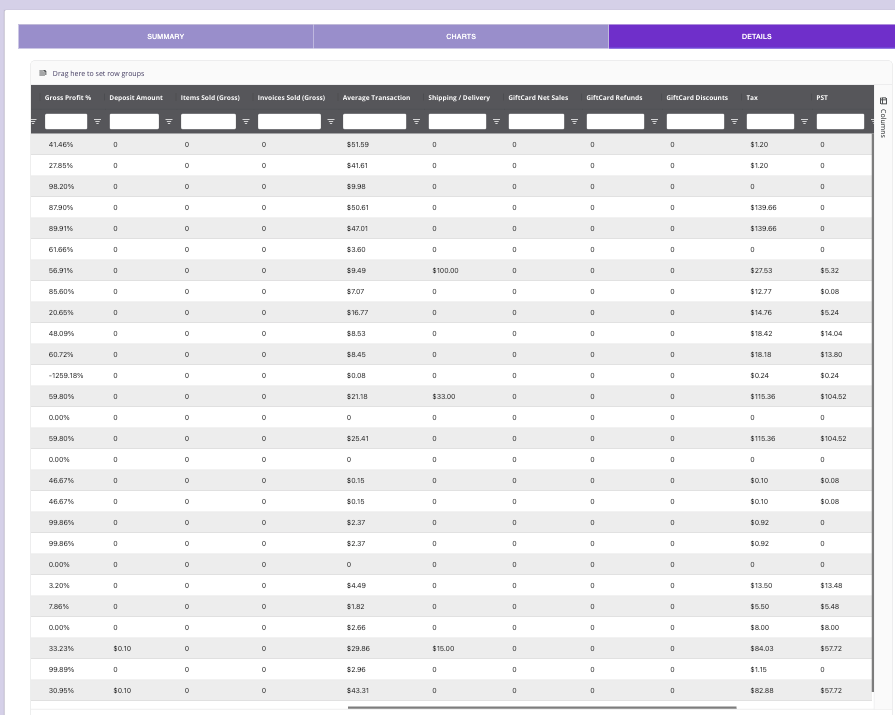
- Columns Include
- Date
- Type (Total / Cannabis / NonCannabis / Online / InStore)
- Gross Sales
- Net Sales
- Discounts
- Exact Costs
- Weighted Avg Costs
- Refund Amount
- Tax
- Gross Profit
- Gross Profit %
- Deposit Amount
- Shipping / Delivery
- GiftCard Net Sales
- GiftCard Refunds
- GiftCard Discounts
- Data Grid Features
- Sort by any column
- Filter(drag a column into “Drag here to set row groups”)
- Resize / Move columns
- Show/Hide columns using the sidebar You can filter rows like:
- Type = CannabisInStore
- Gross Profit % < 30%
- Date = 2025-11-03 This section is crucial for audit trails and deep sales analysis.
5. Exporting the Report
Click DOWNLOAD REPORT to export a CSV.
The export includes:
- Summary metrics
- Cannabis vs non-cannabis summary
- In-store vs online breakdown
- Detailed row-level data (based on Included Fields filter)
Exports respect all filters:
- Date range
- Branch
- Category / Type
- Group By
- Included fields
6. Tips for Effective Use
- Use Group By: Daily for operational trends; use Weekly for management-level performance.
- Compare Cannabis vs Non-Cannabis to spot compliance or pricing issues.
- Use Gross Profit % filtering to isolate low-margin days/products.
- Check Refund Amount spikes—they often indicate customer issues or product problems.
- Use InStore vs Online to evaluate digital performance.
- Use the Included Fields dropdown to create clean CSV exports for accountants.