Navigation Steps: Go to Menu > Reports > Sell Through Report
1. Report Filters
Use the filters at the top of the page to define the time range and store.
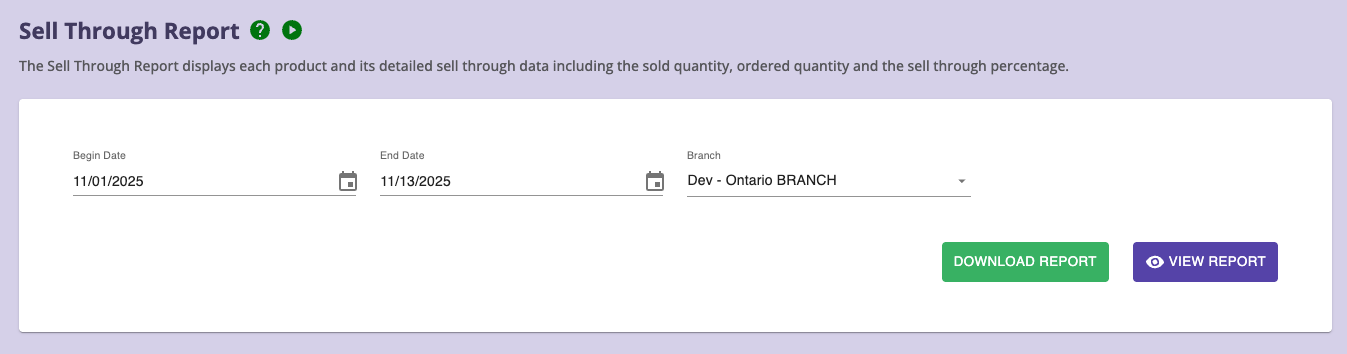
Available Filters
-
Begin Date / End Date
Select the reporting period.
-
Branch (required)
Choose the branch you want to analyze, default is current branch.
Actions
-
VIEW REPORT - Displays the results directly on screen.
-
DOWNLOAD REPORT – Exports the report as a CSV.
2. Understanding Sell Through
The report calculates sell through at a brand level:
Sell Through % = (Sold Qty ÷ Ordered Qty) × 100
- A higher percentage means the brand is selling well.
- A low or negative percentage may indicate:
- Overstock
- Poor product mix
- Items not yet received
- Refunds or adjustments impacting Sold Qty
3. Sell Through Data Grid
After clicking View Report, the results appear in an interactive AgGrid table.
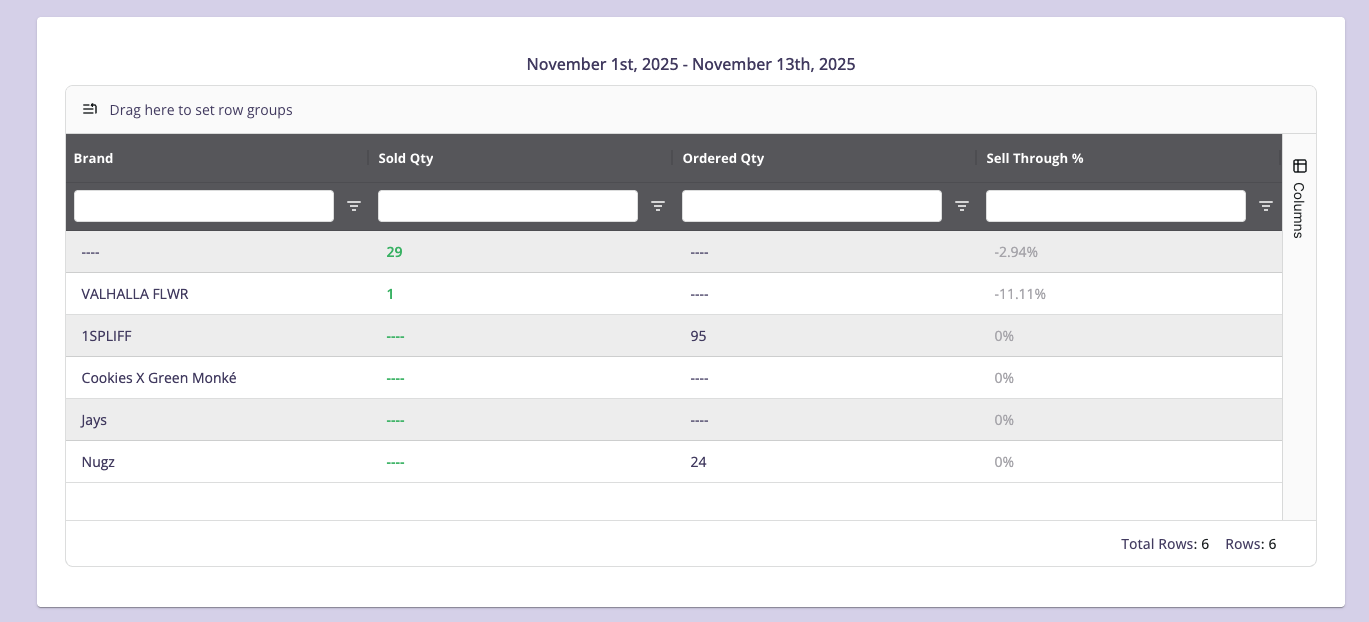
Columns
- Brand
- Sold Qty
- Ordered Qty
- Sell Through %
Reading the Table
- Sold Qty may show negative values if refunds occurred during the selected period.
- Ordered Qty shows how many units were stocked during the same period.
- If Ordered Qty = 0, sell through is shown as 0%.
- Negative sell through occurs when refunds exceed sales.
4. Data Grid (Sorting, Filtering, Search)
You can sort, filter, and analyze data easily in the grid.
Sorting
Click on the column headers to sort ascending or descending:
- Sort by Sold Qty to identify top-selling brands.
- Sort by Sell Through % to compare performance.
Filtering
Each column includes:
- A search field
- A filter icon for advanced filtering (greater than, less than, equals)
Examples:
- Filter Sell Through % < 20% to find underperforming brands
- Search brand names directly
5. Exporting the Report
Click Download Report to export the CSV file.
The exported file respects:
- Date range
- Branch
- All sorting or filtering applied in the grid
Use the CSV for:
- Purchasing planning
- Inventory reviews
- Vendor performance evaluations
- Monthly/weekly sell through snapshots
6. Tips for Effective Use
- Compare Sold Qty vs Ordered Qty before placing new POs.
- Use Sell Through % to identify:
- Fast-moving brands
- Slow sellers that may need promotions
- Investigate brands where:
- Sell through is negative (excessive refunds)
- Ordered Qty is high but Sold Qty is low