Navigation
- Business Insight > Top Selling Products > View Full Report
- Reports > Sales Section > Top Selling Product


1. Report Filters
Use the filter panel to define which products you want to include in the report.
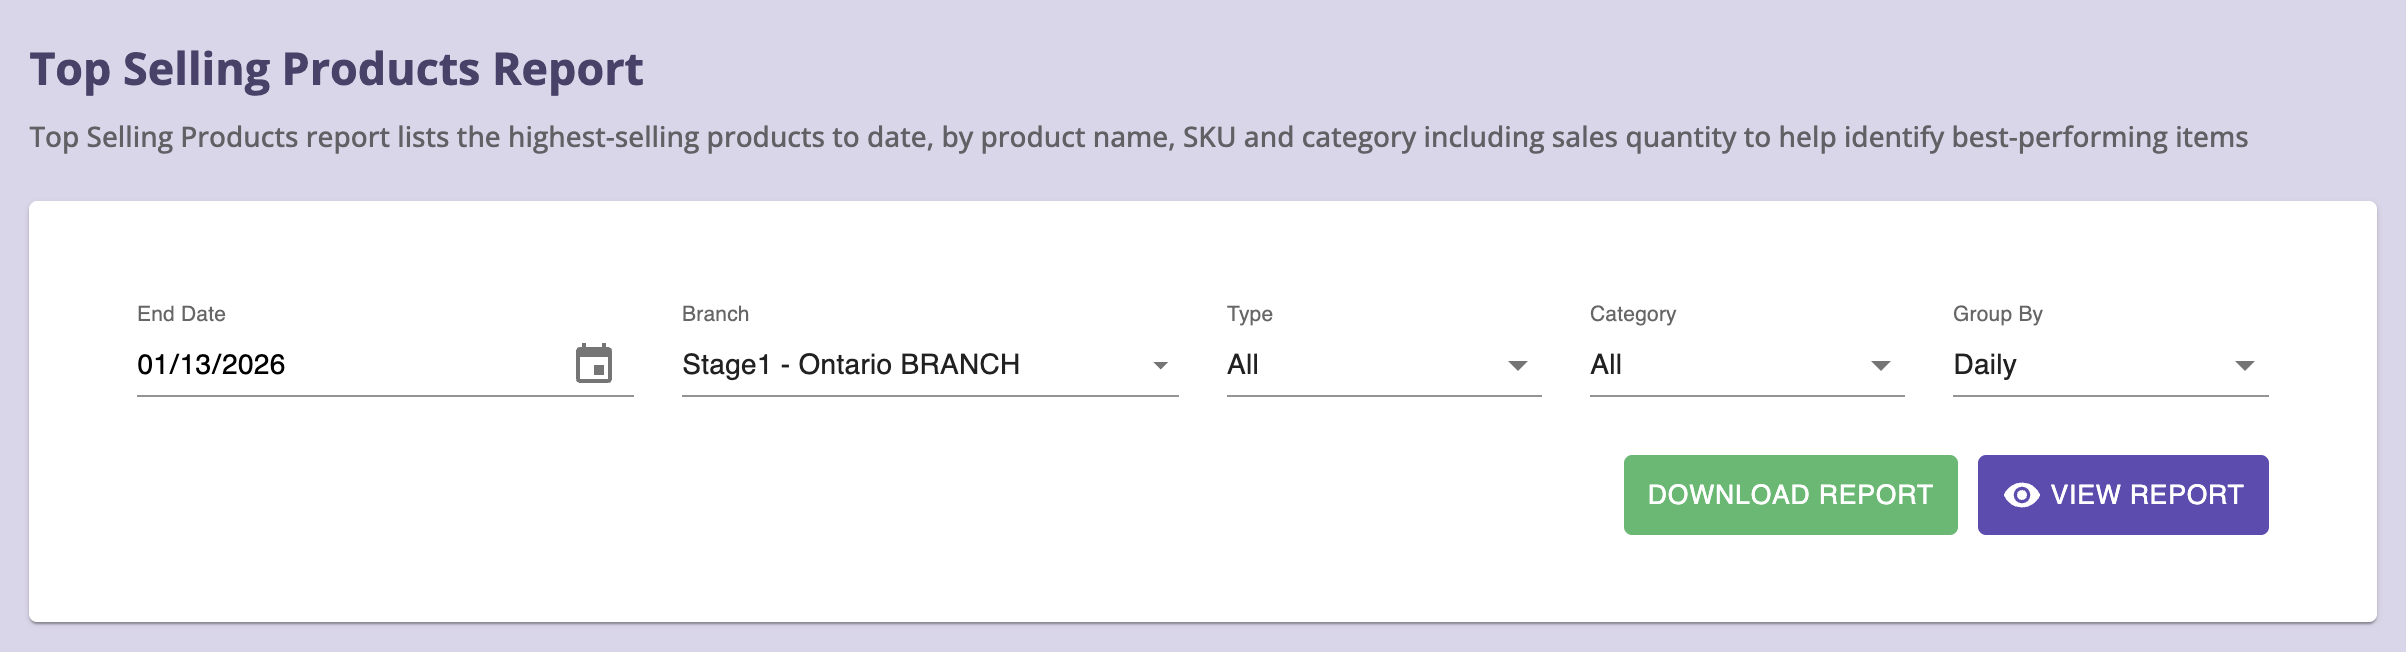
Filter Options
- End Date: Choose a custom End Date for sales activity.
- Branch: Choose the store branch. Default is current branch; supports multiple selection.
- Type: All / Cannabis / Non-Cannabis
- Category: Filter product by Category
- Group By: Select the date range grouping: Daily, Weekly, or Monthly
Actions
- VIEW REPORT – Generates the full report with tables & charts.
- DOWNLOAD REPORT – Exports results in CSV format.
Notes on Data
- How “Total Sold” is Calculated
Total Sold= Sum of all quantities sold for that product within the selected branch, filters, and date range.
Includes:- Completed sales
- All valid order types included in the system’s reporting logic
- Voided transactions
- Refunded quantities (if configured in backend rules)
- Ranking is driven by Total Sold, not profit.
- The report is quantity-based, not revenue-based.
- Results depend on:
- Branch configuration
- Transaction status rules
- Product categorization accuracy
2. Top Selling Products Detail Grid
This is the main section of the report, listing all product-level transactions.
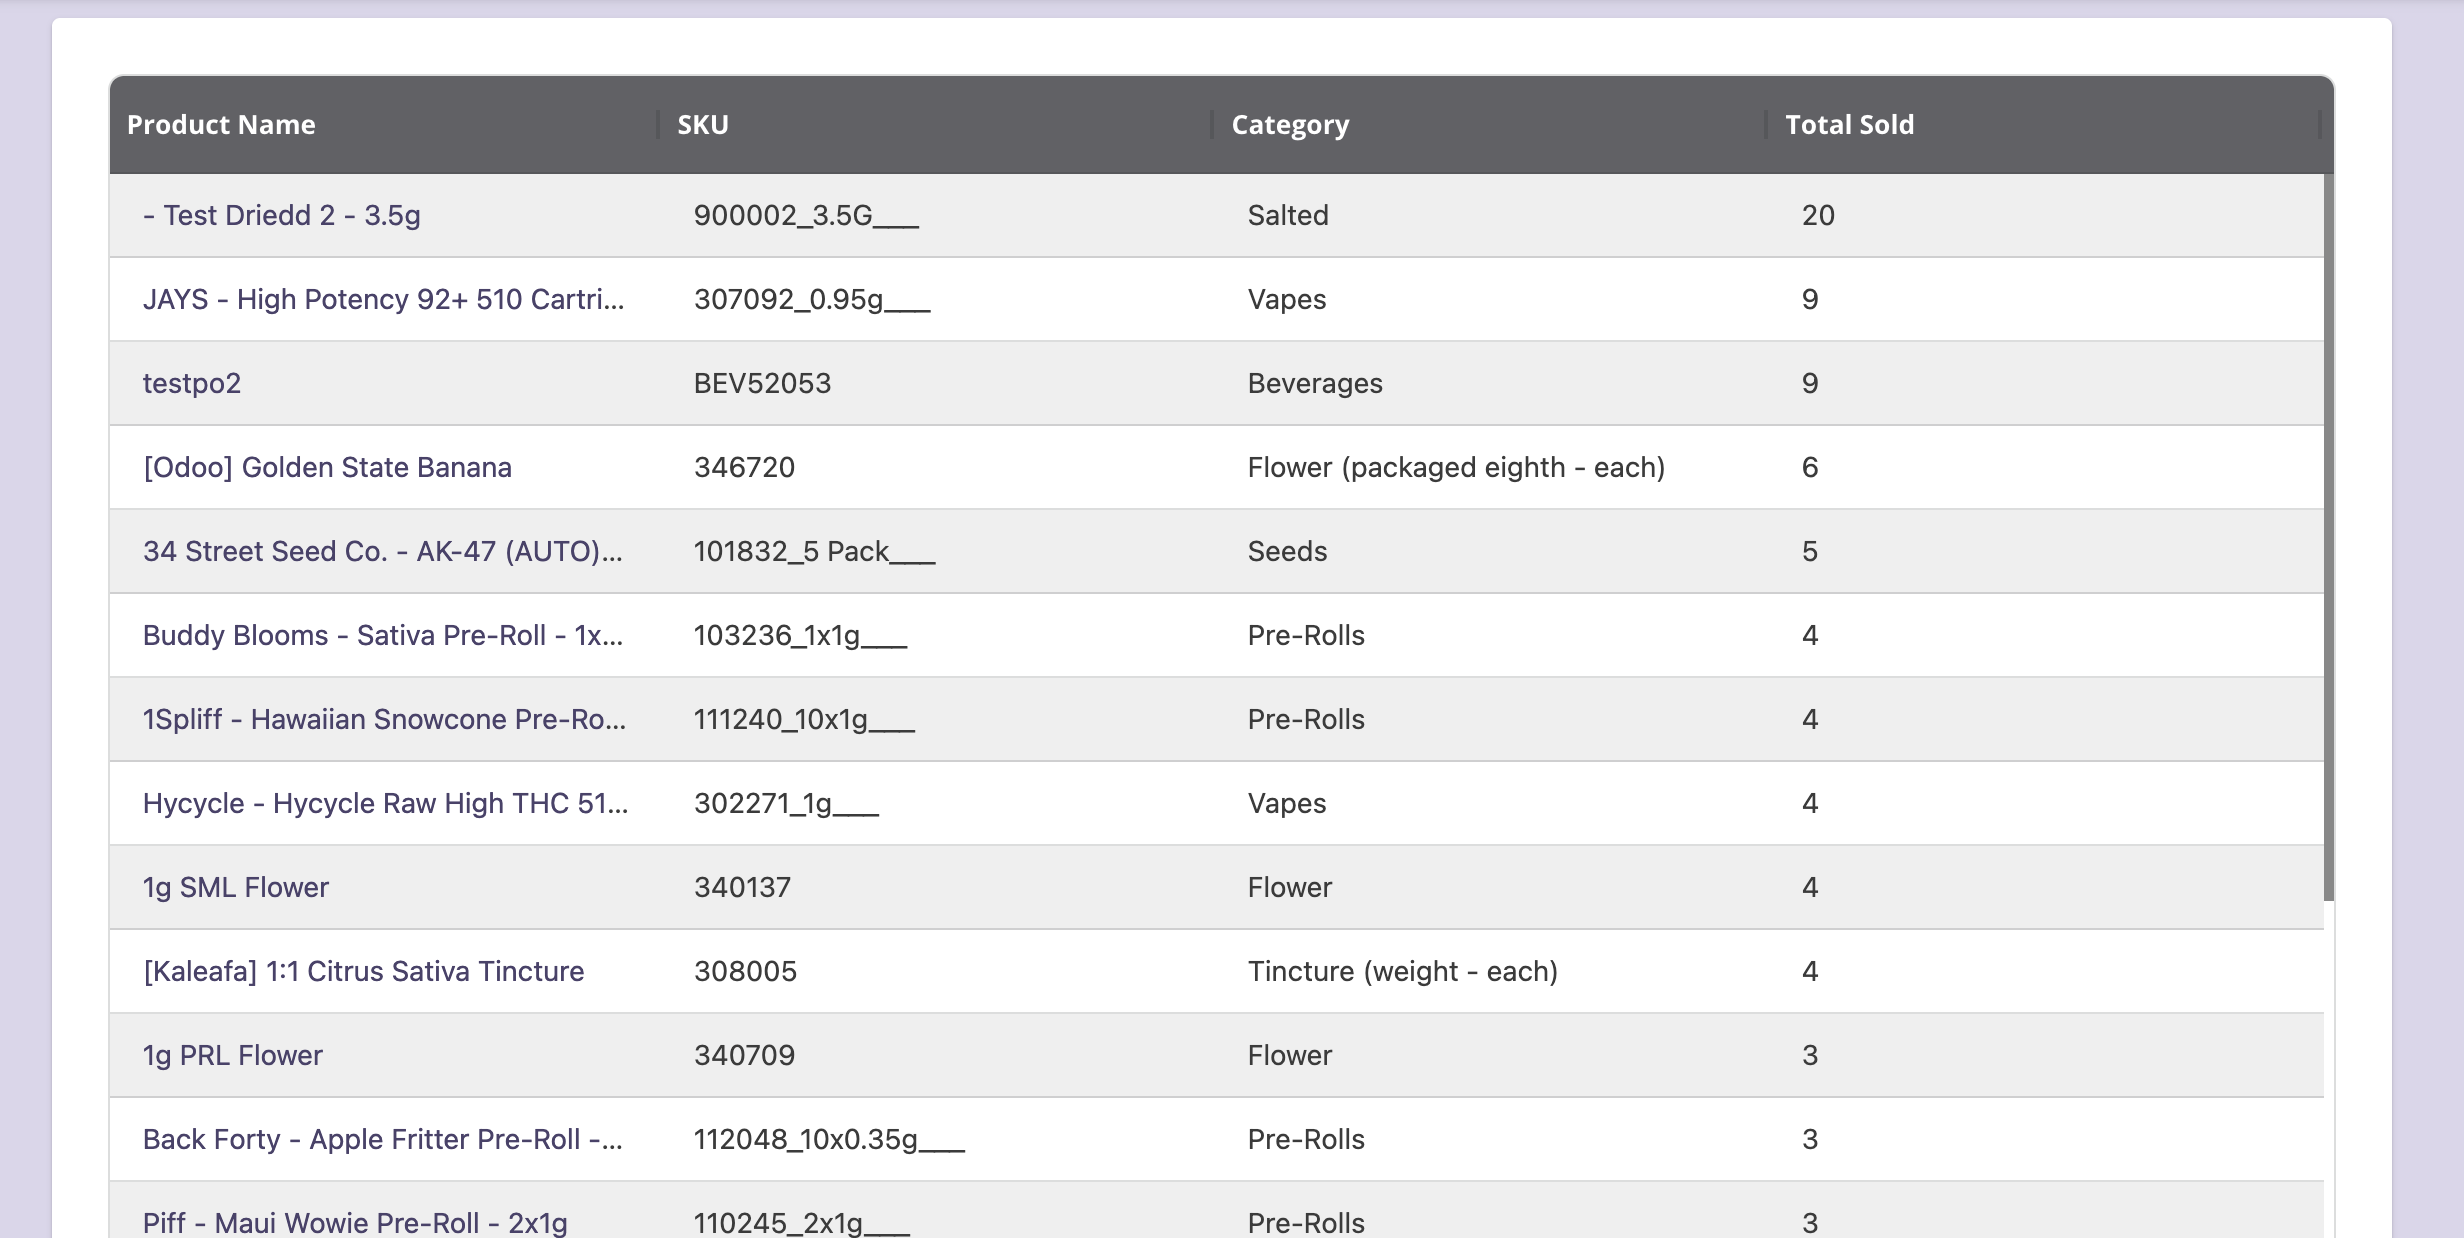
Columns
- Product Name
- SKU
- Category
- Total Sold
3. Data Grid
Resizing & Reordering
- Drag the right edge of the column to resize
- Drag headers left/right to reorder
4. Exporting Data
Click Download Report to export a CSV that includes:
- ProductId
- TotalSold
- ProductName
- SKU
- CategoryId
- CategoryName
- IsCannabis
5. Tips for Effective Use
To get the most value from the Top Selling Products Report, consider the following best practices:
Use consistent time checkpoints
Run the report on the same day each week or month (for example, every Monday or on the 1st of each month). This makes trends easier to compare over time and avoids misleading spikes.
Compare branches, not just totals
Switch between branches to spot:
- Local best-sellers
- Underperforming locations
- Inventory imbalance between stores
This is especially useful for stock transfers and targeted promotions.