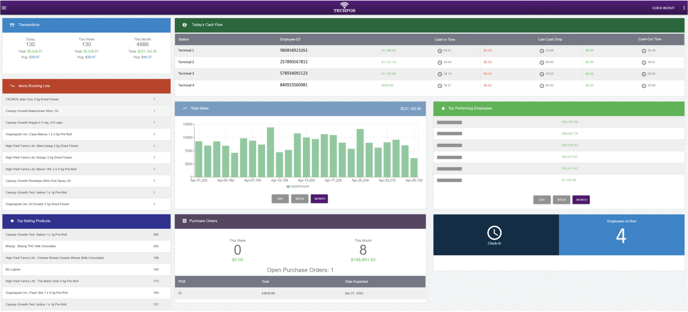
Your Business Insights dashboard will provide you with a view of Key Performance Indicators for your business in real time.
This page consists of various KPIs such as Items Running Low, Top Selling Products, Cash Flow per till, Purchase Orders, Total Sales, and more. This information will help owners keep track of the company's efficiency towards business activities.
What Does Each KPI Widget Reflect?
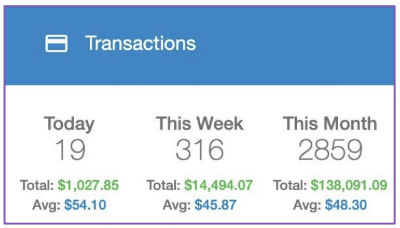
Transactions: This section will show the total transactions made daily, weekly, and monthly. It will also reflect the total sales and average amount per order.
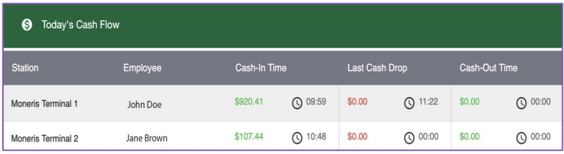
Today's Cash Flow: This tracks an employee's cash-in time/cash-out time as well as their last cash drop time. The system will show the amount for each, and indicate which terminal the cash was managed on.
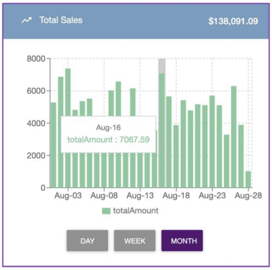
Total Sales: The system will create a chart providing an overview of your store's sales. This will allow you to compare your sales for each day, week, or month.
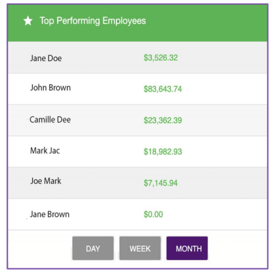
Top Performing Employees: Here, you will be able to see which employee has the most efficient performance by their total sales per hours worked. The system will rank your staff's accomplishments from most sales to least.
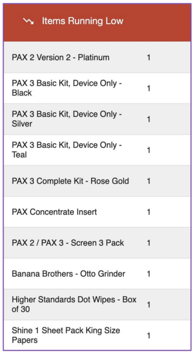
Items Running Low: In terms of your inventory, the system will create a list notifying which items are running low in your store.
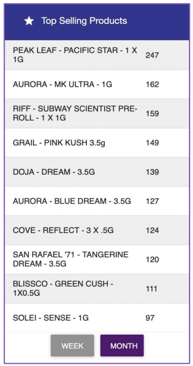
Top Selling Products: Here, you will be able to access a list of the top selling products within your store based off of your customer demographic.
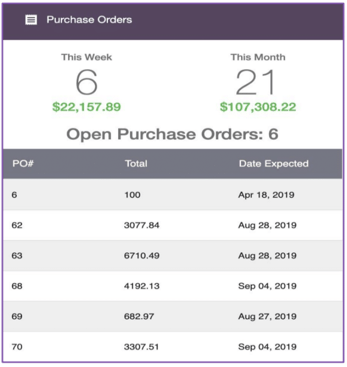
Purchase Orders: This is where you can view a brief summary of your purchase orders. In this section, you will see an overview of purchase orders that were not completed as well as how many orders were placed.